Tracking a city's winter heat from orbit
New thermal maps are helping planners find waste heat, draughty blocks, and public buildings to fix first.
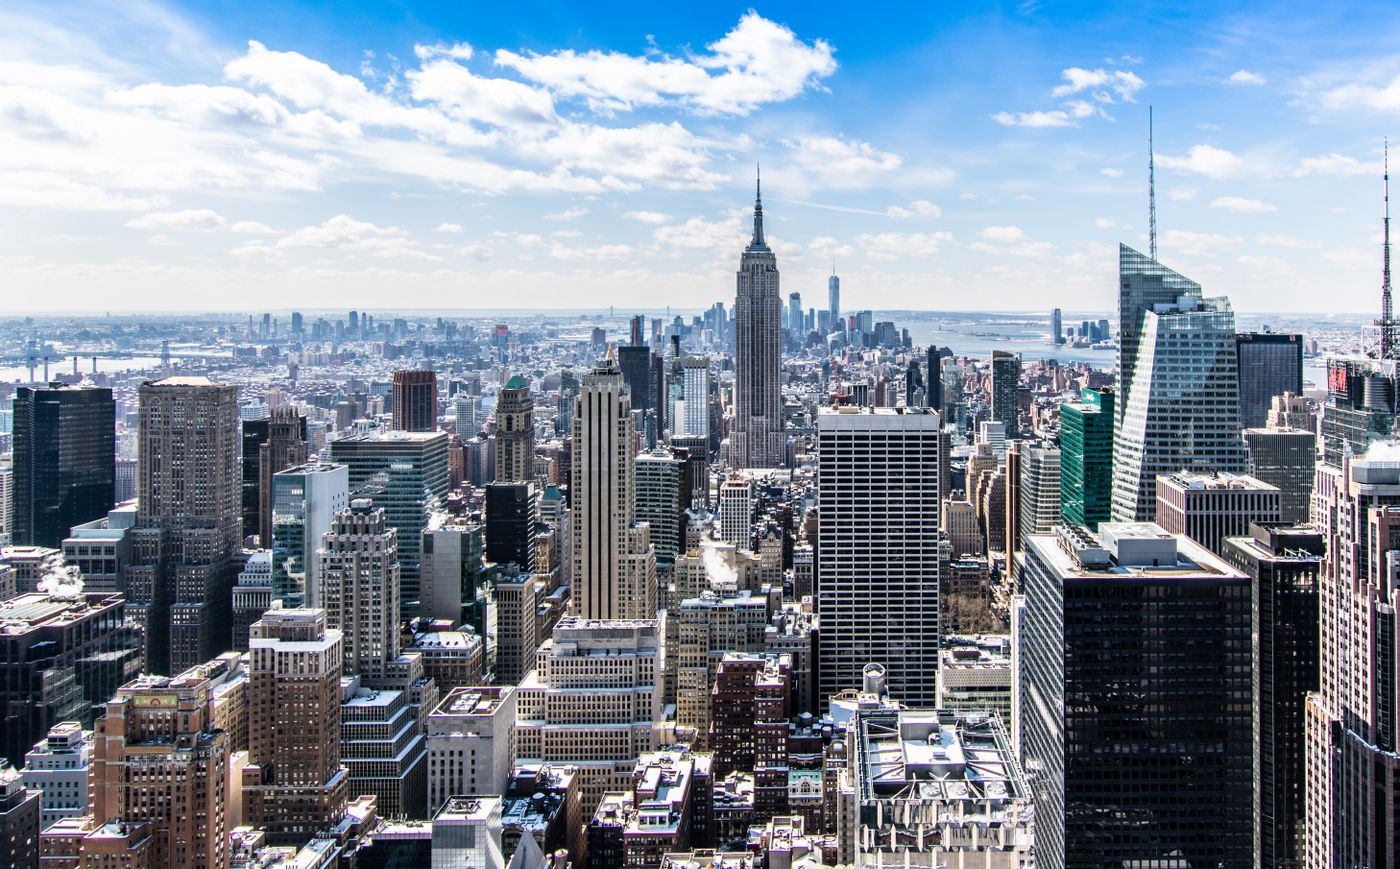
The city in infrared: red roofs are an invitation, blue ones a compliment.
From orbit, the city in January is a confession. Rooftops glow where insulation fails, factories bloom orange with waste heat, and one municipal swimming pool — since fixed — shone like a small sun.
The council commissioned the thermal survey to plan its retrofit programme. Instead of auditing buildings one by one, it photographed all of them at once, from 500 kilometres up, on the three coldest nights of the year.
The worst roofs first
The map reordered the queue overnight. A celebrated eco-development turned out to leak like a sieve; a despised 1960s estate turned out to be solid. “The satellite doesn't read press releases,” the retrofit director says. Funding now follows the infrared, not the reputation.
Heat worth harvesting
The survey's second gift was waste heat: bakeries, laundries, a data centre and one very warm brewery, all venting enough warmth to heat neighbouring streets. Two district-heating schemes are now designed around heat the city was throwing away.
Key points
- Whole-city thermal survey flown on the three coldest nights
- Retrofit funding reordered by measured heat loss
- Two heating schemes designed around captured waste heat
The pool, asked about its starring role in the imagery, has taken it well — its new cover is infrared-black, the highest compliment the survey can pay. Next winter the map flies again, and the city gets to watch itself cool down.
Related stories


Signals, weekly, in plain English.
The technology stories that will matter to public life — without the hype cycle.